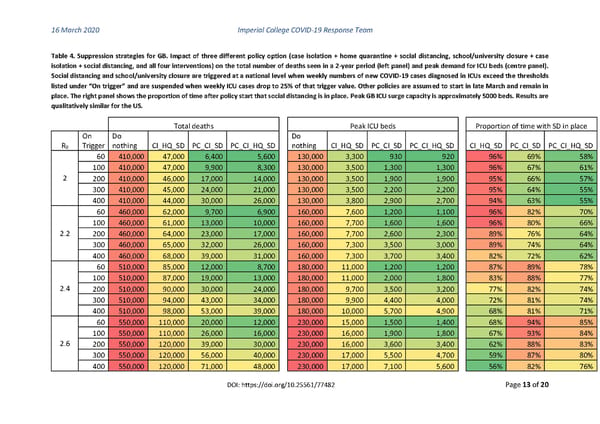
16 March 2020 Imperial College COVID-19 Response Team Table 4. Suppression strategies for GB. Impact of three different policy option (case isolation + home quarantine + social distancing, school/university closure + case isolation + social distancing, and all four interventions) on the total number of deaths seen in a 2-year period (left panel) and peak demand for ICU beds (centre panel). Social distancing and school/university closure are triggered at a national level when weekly numbers of new COVID-19 cases diagnosed in ICUs exceed the thresholds listed under “On trigger” and are suspended when weekly ICU cases drop to 25% of that trigger value. Other policies are assumed to start in late March and remain in place. The right panel shows the proportion of time after policy start that social distancing is in place. Peak GB ICU surge capacity is approximately 5000 beds. Results are qualitatively similar for the US. Total deaths Peak ICU beds Proportion of time with SD in place On Do Do R Trigger nothing CI_HQ_SD PC_CI_SD PC_CI_HQ_SD nothing CI_HQ_SD PC_CI_SD PC_CI_HQ_SD CI_HQ_SD PC_CI_SD PC_CI_HQ_SD 0 60 410,000 47,000 6,400 5,600 130,000 3,300 930 920 96% 69% 58% 100 410,000 47,000 9,900 8,300 130,000 3,500 1,300 1,300 96% 67% 61% 2 200 410,000 46,000 17,000 14,000 130,000 3,500 1,900 1,900 95% 66% 57% 300 410,000 45,000 24,000 21,000 130,000 3,500 2,200 2,200 95% 64% 55% 400 410,000 44,000 30,000 26,000 130,000 3,800 2,900 2,700 94% 63% 55% 60 460,000 62,000 9,700 6,900 160,000 7,600 1,200 1,100 96% 82% 70% 100 460,000 61,000 13,000 10,000 160,000 7,700 1,600 1,600 96% 80% 66% 2.2 200 460,000 64,000 23,000 17,000 160,000 7,700 2,600 2,300 89% 76% 64% 300 460,000 65,000 32,000 26,000 160,000 7,300 3,500 3,000 89% 74% 64% 400 460,000 68,000 39,000 31,000 160,000 7,300 3,700 3,400 82% 72% 62% 60 510,000 85,000 12,000 8,700 180,000 11,000 1,200 1,200 87% 89% 78% 100 510,000 87,000 19,000 13,000 180,000 11,000 2,000 1,800 83% 88% 77% 2.4 200 510,000 90,000 30,000 24,000 180,000 9,700 3,500 3,200 77% 82% 74% 300 510,000 94,000 43,000 34,000 180,000 9,900 4,400 4,000 72% 81% 74% 400 510,000 98,000 53,000 39,000 180,000 10,000 5,700 4,900 68% 81% 71% 60 550,000 110,000 20,000 12,000 230,000 15,000 1,500 1,400 68% 94% 85% 100 550,000 110,000 26,000 16,000 230,000 16,000 1,900 1,800 67% 93% 84% 2.6 200 550,000 120,000 39,000 30,000 230,000 16,000 3,600 3,400 62% 88% 83% 300 550,000 120,000 56,000 40,000 230,000 17,000 5,500 4,700 59% 87% 80% 400 550,000 120,000 71,000 48,000 230,000 17,000 7,100 5,600 56% 82% 76% DOI: https://doi.org/10.25561/77482 Page 13 of 20
 Non-Pharmaceutical Interventions to reduce COVID-19 mortality and healthcare demand Page 12 Page 14