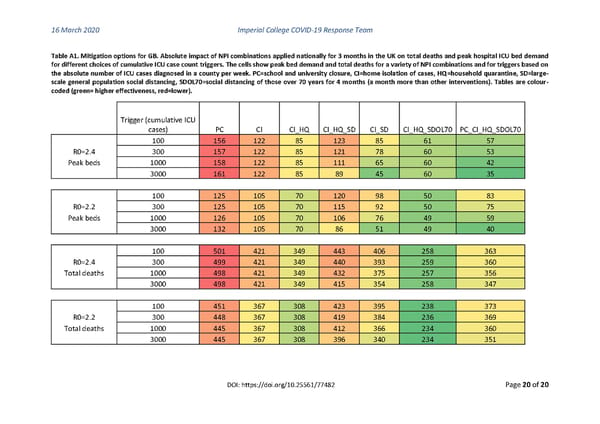
16 March 2020 Imperial College COVID-19 Response Team Table A1. Mitigation options for GB. Absolute impact of NPI combinations applied nationally for 3 months in the UK on total deaths and peak hospital ICU bed demand for different choices of cumulative ICU case count triggers. The cells show peak bed demand and total deaths for a variety of NPI combinations and for triggers based on the absolute number of ICU cases diagnosed in a county per week. PC=school and university closure, CI=home isolation of cases, HQ=household quarantine, SD=large- scale general population social distancing, SDOL70=social distancing of those over 70 years for 4 months (a month more than other interventions). Tables are colour- coded (green= higher effectiveness, red=lower). Trigger (cumulative ICU cases) PC CI CI_HQ CI_HQ_SD CI_SD CI_HQ_SDOL70 PC_CI_HQ_SDOL70 100 156 122 85 123 85 61 57 R0=2.4 300 157 122 85 121 78 60 53 Peak beds 1000 158 122 85 111 65 60 42 3000 161 122 85 89 45 60 35 100 125 105 70 120 98 50 83 R0=2.2 300 125 105 70 115 92 50 75 Peak beds 1000 126 105 70 106 76 49 59 3000 132 105 70 86 51 49 40 100 501 421 349 443 406 258 363 R0=2.4 300 499 421 349 440 393 259 360 Total deaths 1000 498 421 349 432 375 257 356 3000 498 421 349 415 354 258 347 100 451 367 308 423 395 238 373 R0=2.2 300 448 367 308 419 384 236 369 Total deaths 1000 445 367 308 412 366 234 360 3000 445 367 308 396 340 234 351 DOI: https://doi.org/10.25561/77482 Page 20 of 20
 Non-Pharmaceutical Interventions to reduce COVID-19 mortality and healthcare demand Page 19