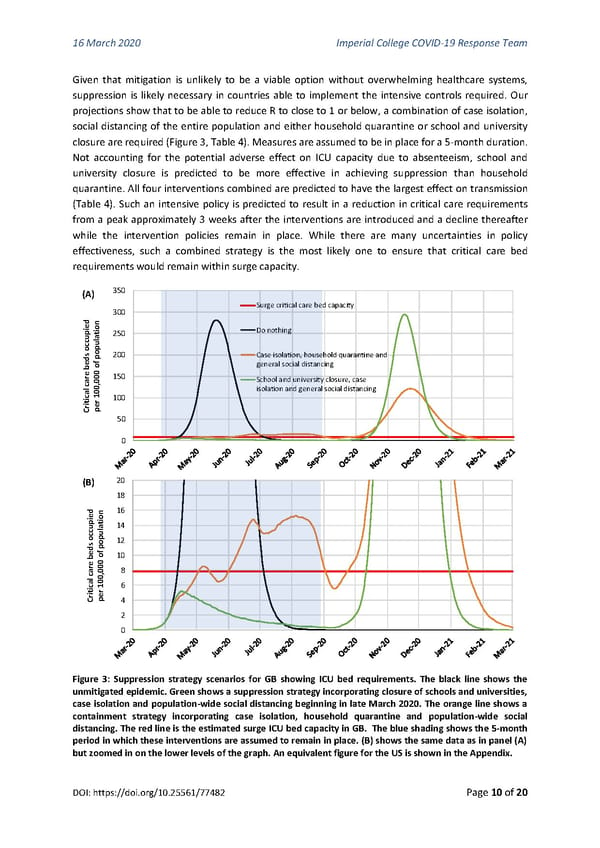
16 March 2020 Imperial College COVID-19 Response Team Given that mitigation is unlikely to be a viable option without overwhelming healthcare systems, suppression is likely necessary in countries able to implement the intensive controls required. Our projections show that to be able to reduce R to close to 1 or below, a combination of case isolation, social distancing of the entire population and either household quarantine or school and university closure are required (Figure 3, Table 4). Measures are assumed to be in place for a 5-month duration. Not accounting for the potential adverse effect on ICU capacity due to absenteeism, school and university closure is predicted to be more effective in achieving suppression than household quarantine. All four interventions combined are predicted to have the largest effect on transmission (Table 4). Such an intensive policy is predicted to result in a reduction in critical care requirements from a peak approximately 3 weeks after the interventions are introduced and a decline thereafter while the intervention policies remain in place. While there are many uncertainties in policy effectiveness, such a combined strategy is the most likely one to ensure that critical care bed requirements would remain within surge capacity. (A) 350 300 Surge critical care bed capacity dietion Do nothing ccupaul250 ods pop200 Case isolation, household quarantine and ee b0 of general social distancing r ca,00150 School and university closure, case lica 100 isolation and general social distancing trier 100 C p 50 0 (B) 20 18 dieion16 tula14 ccups oop12 dbe ofp 10 re00 cal 00,8 caitir 016 rC pe 4 2 0 Figure 3: Suppression strategy scenarios for GB showing ICU bed requirements. The black line shows the unmitigated epidemic. Green shows a suppression strategy incorporating closure of schools and universities, case isolation and population-wide social distancing beginning in late March 2020. The orange line shows a containment strategy incorporating case isolation, household quarantine and population-wide social distancing. The red line is the estimated surge ICU bed capacity in GB. The blue shading shows the 5-month period in which these interventions are assumed to remain in place. (B) shows the same data as in panel (A) but zoomed in on the lower levels of the graph. An equivalent figure for the US is shown in the Appendix. DOI: https://doi.org/10.25561/77482 Page 10 of 20
 Non-Pharmaceutical Interventions to reduce COVID-19 mortality and healthcare demand Page 9 Page 11