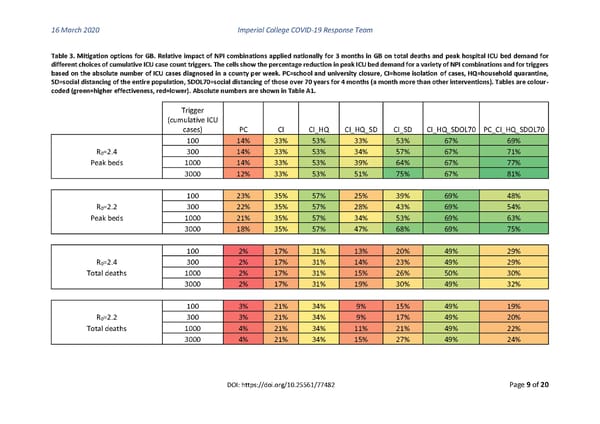
16 March 2020 Imperial College COVID-19 Response Team Table 3. Mitigation options for GB. Relative impact of NPI combinations applied nationally for 3 months in GB on total deaths and peak hospital ICU bed demand for different choices of cumulative ICU case count triggers. The cells show the percentage reduction in peak ICU bed demand for a variety of NPI combinations and for triggers based on the absolute number of ICU cases diagnosed in a county per week. PC=school and university closure, CI=home isolation of cases, HQ=household quarantine, SD=social distancing of the entire population, SDOL70=social distancing of those over 70 years for 4 months (a month more than other interventions). Tables are colour- coded (green=higher effectiveness, red=lower). Absolute numbers are shown in Table A1. Trigger (cumulative ICU cases) PC CI CI_HQ CI_HQ_SD CI_SD CI_HQ_SDOL70 PC_CI_HQ_SDOL70 100 14% 33% 53% 33% 53% 67% 69% R =2.4 300 14% 33% 53% 34% 57% 67% 71% 0 Peak beds 1000 14% 33% 53% 39% 64% 67% 77% 3000 12% 33% 53% 51% 75% 67% 81% 100 23% 35% 57% 25% 39% 69% 48% R =2.2 300 22% 35% 57% 28% 43% 69% 54% 0 Peak beds 1000 21% 35% 57% 34% 53% 69% 63% 3000 18% 35% 57% 47% 68% 69% 75% 100 2% 17% 31% 13% 20% 49% 29% R =2.4 300 2% 17% 31% 14% 23% 49% 29% 0 Total deaths 1000 2% 17% 31% 15% 26% 50% 30% 3000 2% 17% 31% 19% 30% 49% 32% 100 3% 21% 34% 9% 15% 49% 19% R =2.2 300 3% 21% 34% 9% 17% 49% 20% 0 Total deaths 1000 4% 21% 34% 11% 21% 49% 22% 3000 4% 21% 34% 15% 27% 49% 24% DOI: https://doi.org/10.25561/77482 Page 9 of 20
 Non-Pharmaceutical Interventions to reduce COVID-19 mortality and healthcare demand Page 8 Page 10